Matplotlib: Basic Plotting
Introduction to plot function of Matplotlib
Matplotlib is a mathematical library which allow us to bring life to data and translate them into graphs which tells us a story.
Some of these graphs are more complex compared to others and depending on what you would like to show would imply different items.
need nice graphs here
First, we would need to import the matplotlib the plotting library for python using the following command:
import matplotlib.pyplot as plt
If we want to make a plot between 2 variables (x and y), we would need two arrays / lists containing these values for the varaibles. For this example, we have x and y containing three values each. We can make use of the plt.plot() function to do so.
x = [1,2,3]
y = [4,2,0]

plt.plot(x,y)
plt.show()
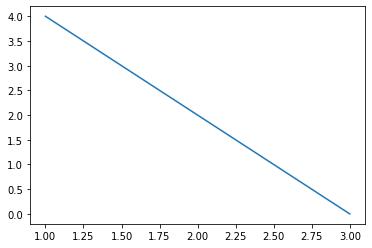
It is important to note that the order of the variables matter when using plt.plot(). In our example, since we want our x variable to be on the x-axis and y variable to be on the y-axis, the command is plt.plot(x,y). If we want our x variable to be on the y-axis and y variable on the x-axis, the command would look like plt.plot(y,x)!