Matplotlib: Basic Plotting
Utilizing arguments in matplotlib
Using Markers, Linestyle and Color
From the previous section, we showed the basics of plotting two variables against each other. However, changing the aesthetics of the graph is also important in data visualisation / presentation. Some aesthetics include marker type, linestyle and color. These aesthetics are changed in the plt.plot() function as additional arguments.
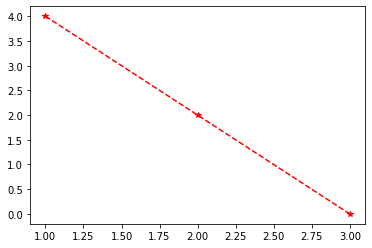
For this example, we chose to have a ‘*' marker, ‘dashed' linestyle and a ‘r' color plot.
x = [1,2,3]
y = [4,2,0]

plt.plot(x,y, marker = '*',linestyle = 'dashed',color = 'r')
plt.show()
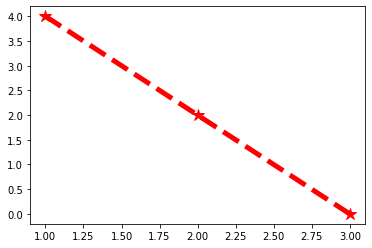
Using the same plot and values, we can also change the size of the points / marker using markersize, the width of the line using linewidth and changing the colour using the hex colour code.
x = [1,2,3]
y = [4,2,0]

plt.plot(x,y , marker='*', linestyle = 'dashed', color = '#ff0000', markersize = 12, linewidth = 5)
plt.show()
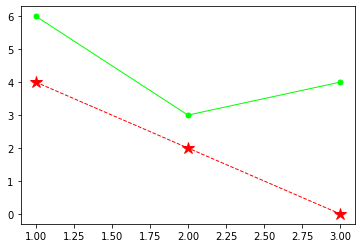
Assuming now we have a third variable z and we want to plot ‘z against x' on the same graph. We can make use of the various aesthetic arguments shown before to differentiate the plots!
x = [1,2,3]
y = [4,2,0]
z = [6,2,4]


plt.plot(x,y , marker='*', linestyle = 'dashed', color = '#ff0000', markersize = 12, linewidth = 1)
plt.plot(x,z , marker='.', linestyle = '-', color = '#00ff00', markersize = 10, linewidth = 1)
plt.show()