Twin Axis
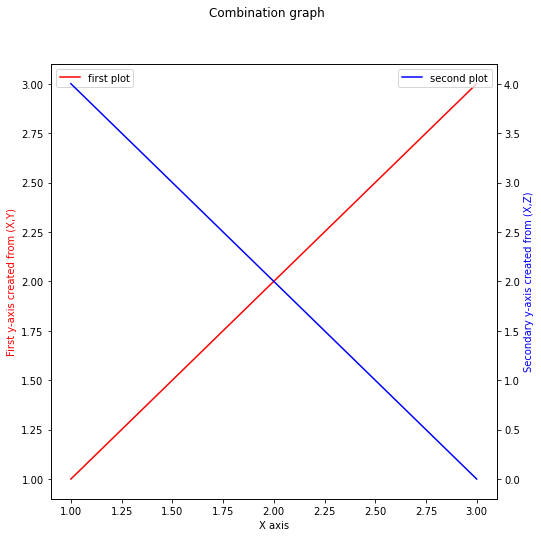
Plotting Secondary Y axis on the same graph
Here, we would explore how one would plot a secondary axis on a separate graph which can be done by utilising plt.subplots() function.
For this example, we would be using two differnet y-axis values y and z while using the same x-axis values x. The main function for this section would be .twinx()!
Our first axis would be named ax1 and by doing ax2 = ax1.twinx(), we are telling python to use the x-axis from ax1 while creating an entirely new y-axis to plot! Since we are using .twinx(), notice that we do not need to do ax2.set_xlabel() since that is already handled by ax1.set_xlabel()!
x = [1,2,3]
y = [1,2,3]
z = [4,2,0]

# Creating a subplot
fig, ax1 = plt.subplots(nrows = 1, ncols = 1, figsize=(8,8))

# ax1
ax1.plot(x,y,label='first plot',color='r')
ax1.set_xlabel('X axis')
ax1.set_ylabel('First y-axis created from (X,Y)', color='red')
ax1.legend()

# ax2
ax2 = ax1.twinx()
ax2.plot(x,z,label='second plot',color='b')
ax2.set_ylabel('Secondary y-axis created from (X,Z)', color='b')
ax2.legend()

# Global plt
plt.suptitle('Combination graph')
plt.show()
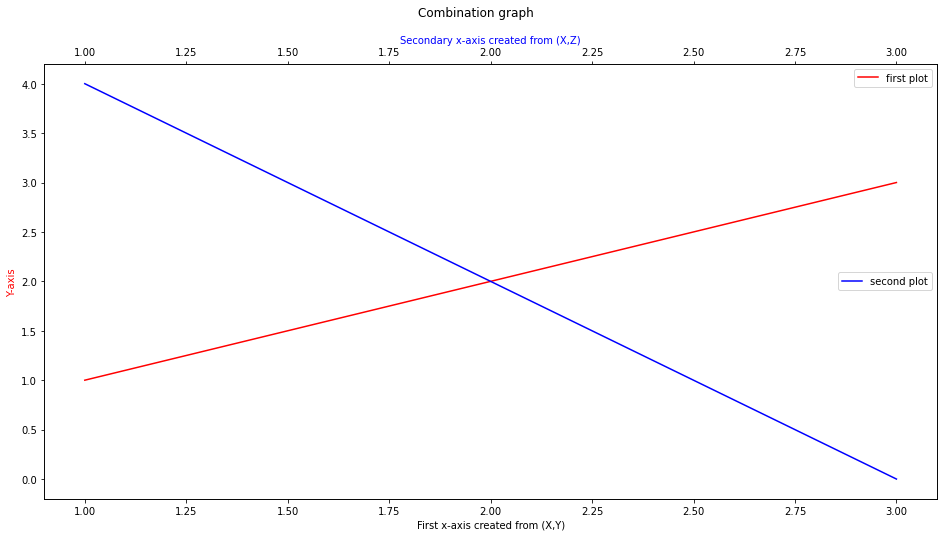
Plotting Secondary X axis on the same graph
Like the .twinx() example, there is a .twiny() function. The utilisation of this function is the exact same as .twinx() except that the y-values must be the same rather than the x-valus.
x = [1,2,3]
y = [1,2,3]
z = [4,2,0]

# Creating a subplot
fig, ax1 = plt.subplots(nrows = 1, ncols = 1, figsize = (16,8))

# ax1
ax1.plot(X,Y,label='first plot',color='r')
ax1.set_xlabel('First x-axis created from (X,Y)')
ax1.set_ylabel('Y-axis', color='red')
ax1.legend()

# ax2
ax2 = ax1.twiny()
ax2.plot(X,Z,label='second plot',color='b')
ax2.set_xlabel('Secondary x-axis created from (X,Z)', color='b')
ax2.legend(loc=7)

# Global plt
plt.suptitle('Combination graph')
plt.show()