Scatterplot
Basic Scatter
First, customary importing of packages and data if you haven't already done so from the previous sections.
import pandas as pd
import matplotlib.pyplot as plt

df = pd.read_csv("https://raw.githubusercontent.com/darren1998s/darren1998s.github.io/main/iris.csv")
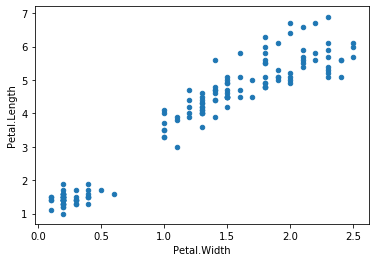
Using the a slightly altered syntax as the bar chart and histogram from the previous sections, we can easily plot scatterplots.
For our example, we are going to plot Petal.Length against Petal.Width.
#How to plot histogram
#df['Petal.Length'].plot(kind='hist')

#Plotting scatterplot
df.plot("Petal.Width", 'Petal.Length', kind='scatter')
plt.show()
Grouped Scatterplots
Likewise, like in our previous example, what if we want to check the correlation between Petal.Length and Petal.Width while points are grouped by each species of Iris ? We can still make use of the df.groupby() function.
However, we would need to employ something that was taught in the matplotlib section, which is plotting by axes.
We would need to call plt.subplots first!
grouped_species = df.groupby("Species")

#Calling plt.subplots().
fig, ax = plt.subplots()

for name, species in grouped_species:
    ax.scatter(species["Petal.Width"], species["Petal.Length"], label=name)

#Don't forget to enable the legend so we know which colour refers to which species!
plt.legend()
plt.ylabel('Petal Length')
plt.xlabel('Petal Width')
plt.show()
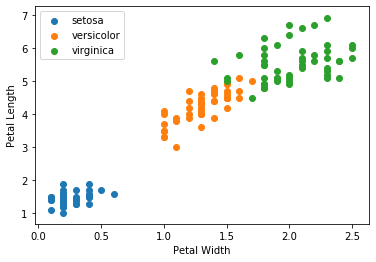
From this scatterplot, we can instantly tell a few things:
-
Petal WidthandPetal Lengthare grouped by each species, with I. virginica having the largest Petals in both widths and length. -
I. setosa has the smallest Petals in both widths and lengths.